Appearance
InfluxDB Setup
InfluxDB is an open-source, high-performance time series database designed for fast data storage and retrieval. It scales across multiple machines and clusters, and includes a built-in web interface for managing data and creating visualizations.
Core Concepts
Before installing, it helps to understand a few InfluxDB-specific terms:
| InfluxDB Term | Comparable To | Description |
|---|---|---|
| Organization | Database (MySQL) | Top-level grouping for your data |
| Bucket | Collection (MongoDB) or Table (MySQL) | A named storage location for time series data |
| Measurement | Table name | A logical grouping of related data points |
| Tag | Indexed column | Metadata used to identify and filter data (e.g., location, device) |
| Field | Data column | The actual measured values (e.g., temperature, CPU usage) |
| Retention Policy | -- | Rules for how long data is kept before automatic deletion |
Installation
INFO
On this course we will use InfluxDB 2, since the version 3 requires Docker containers for the GUI. Docker and containers are not covered on this course
Windows PowerShell
- Open PowerShell as Administrator (search for PowerShell in the Start menu and select "Run as administrator")
- Follow the official installation guide: InfluxDB Windows Install
TIP
The installation guide version may have errors in the extract commands. If the commands fail, check the file and folder names match what was actually downloaded.
powershell
Expand-Archive .\influxdb2-2.8.0-windows_amd64.zip -DestinationPath 'C:\InfluxData\'
C:\InfluxData\influxd.exeAfter installation, start InfluxDB from the command line:
powershell
cd "C:\InfluxData"
.\influxd.exeInfluxDB listens on port 8086 by default. Stop it with Ctrl + C.
Initial Setup
- Open the InfluxDB UI at http://localhost:8086
- On the first launch, you will be asked to set up:
- Username and password
- Organization name
- Initial bucket name
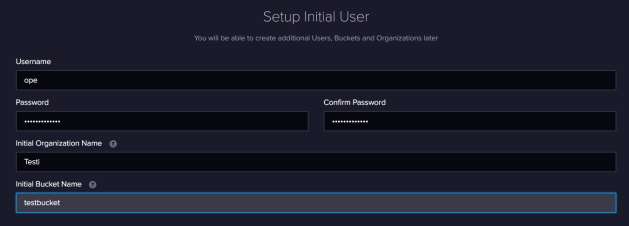
WARNING
Save your username and password -- you will need them to log in later.
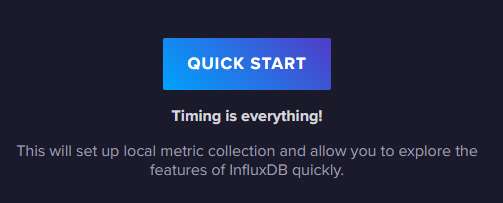
- When asked about setup options, select Quick Start to get started immediately
Navigating the UI
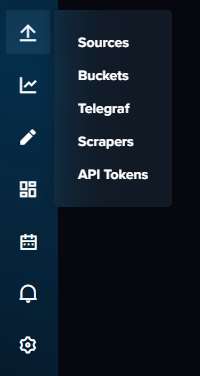
After setup, the InfluxDB web interface provides:
- Buckets -- listed in the left sidebar under "Load Data". You can create new buckets and manage retention policies here
- Data Explorer -- build queries visually or with code to explore your data
- Dashboards -- create and save visualizations of your data
- API Tokens -- manage access tokens for programmatic data access (under "Load Data" > "API Tokens")
Viewing Data
In the Data Explorer, you can:
- Select a bucket and apply filters to build a query
- Toggle View Raw Data to see data in table format
- Switch between visual graph and raw data views
- Export data as CSV
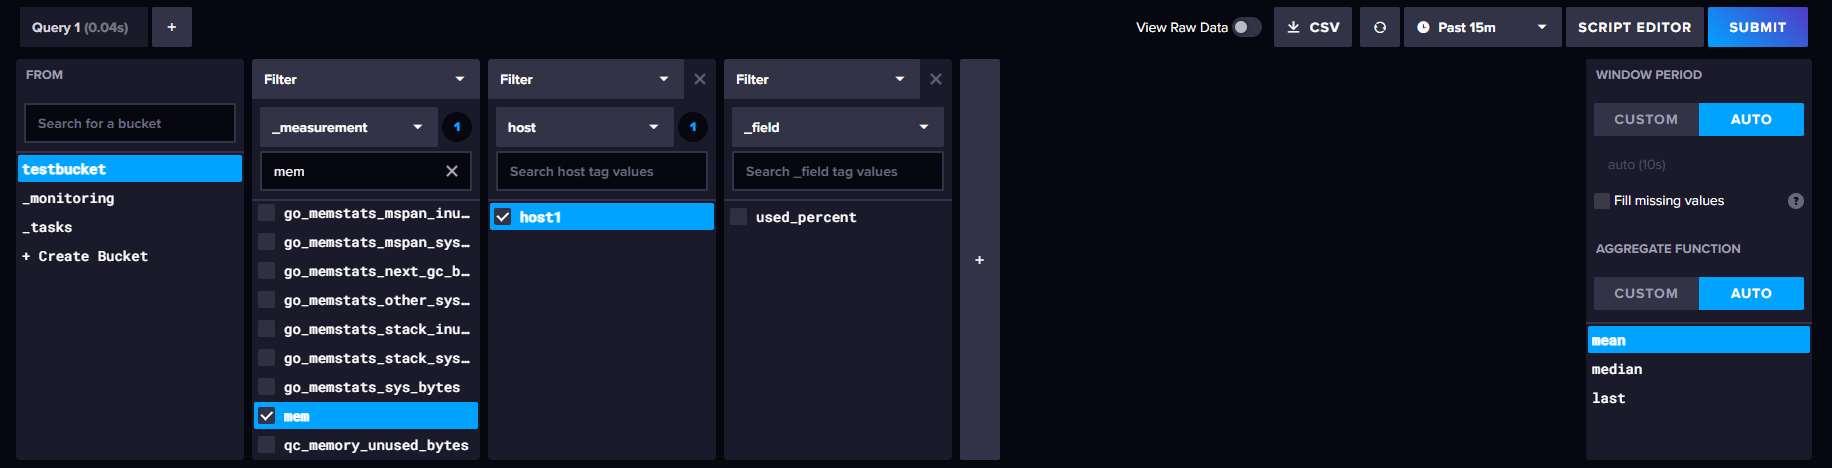
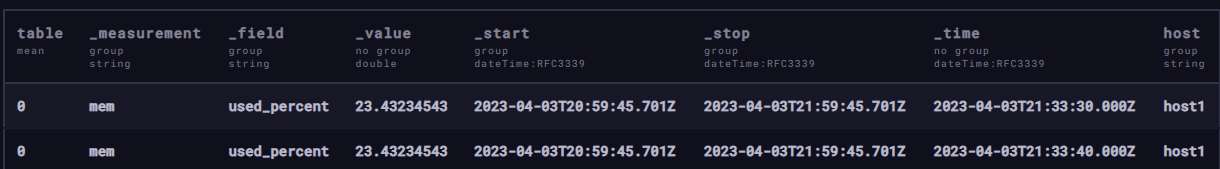
You can also view the raw data in table format:
API Tokens
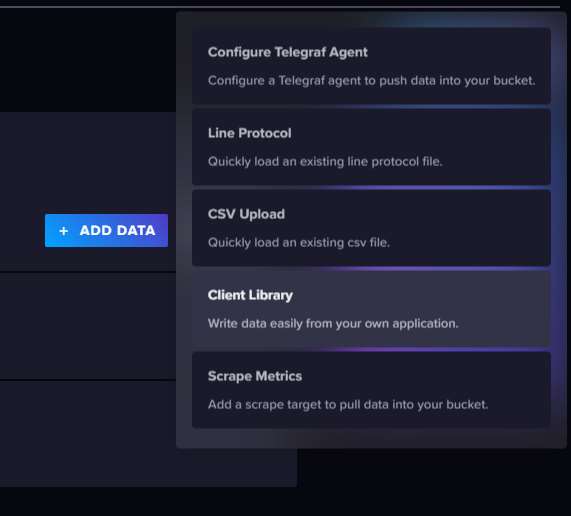
To write or read data programmatically (e.g., from Python), you need an API token. Data can be added in several ways -- via client libraries, line protocol files, CSV uploads, and more:
- Navigate to Load Data > API Tokens in the left sidebar
- Click Generate API Token
- Copy and save the token immediately
WARNING
The token is only displayed once at creation time. If you lose it, you will need to create a new one.
Data Storage: Line Protocol
InfluxDB uses a text-based format called line protocol for writing data. The format is:
measurement,tag_key=tag_value field_key=field_valueFor example:
temperature,location=office current_temp=21.5temperatureis the measurement namelocation=officeis a tag (metadata for filtering)current_temp=21.5is a field (the actual data value)
TIP
Note the comma between the measurement and tags (no space), and the space before the fields.
Multiple tags and fields are separated by commas:
weather,city=Helsinki,station=Kumpula temperature=18.2,humidity=65.0When data is written, InfluxDB automatically adds a timestamp. You can also provide your own timestamp at the end of the line.