Appearance
InfluxDB Queries
InfluxDB 2 uses Flux as its query language. Flux is a functional data scripting language designed for querying, analyzing, and acting on time series data.
InfluxDB 3
The newer InfluxDB 3 has replaced Flux with standard SQL and InfluxQL. This course uses InfluxDB 2 with Flux.
Flux Query Basics
A Flux query is built by chaining operations together using the pipe-forward operator (|>). Each operation takes the output of the previous step as input.
The basic structure of a Flux query:
flux
from(bucket: "my-bucket")
  |> range(start: -1h)
|> filter(fn: (r) => r["_measurement"] == "temperature")This query:
- Selects data from the bucket
"my-bucket" - Limits the time range to the last 1 hour
- Filters for records where the measurement is
"temperature"
Required Elements
Every Flux query must include at least:
from()-- specifies which bucket to queryrange()-- specifies the time range (required for performance reasons)
Time Ranges
The range() function defines what time window to query. You can use relative or absolute times.
Relative Time Ranges
flux
|> range(start: -1h)          // last 1 hour
|> range(start: -1d)          // last 1 day
|> range(start: -7d)          // last 7 days
|> range(start: -30m)         // last 30 minutes
|> range(start: -1h, stop: -30m) // between 1 hour ago and 30 minutes agoAbsolute Time Ranges
flux
|> range(start: 2025-01-01T00:00:00Z, stop: 2025-01-02T00:00:00Z)Filtering
Use filter() to narrow down results. The function takes a predicate -- a function that returns true or false for each record.
flux
// Filter by measurement
|> filter(fn: (r) => r["_measurement"] == "temperature")

// Filter by tag
|> filter(fn: (r) => r["location"] == "office")

// Filter by field name
|> filter(fn: (r) => r["_field"] == "current_temp")You can chain multiple filters:
flux
from(bucket: "my-bucket")
  |> range(start: -1d)
  |> filter(fn: (r) => r["_measurement"] == "mem")
  |> filter(fn: (r) => r["host"] == "host1")
|> filter(fn: (r) => r["_field"] == "used_percent")Or combine conditions in a single filter:
flux
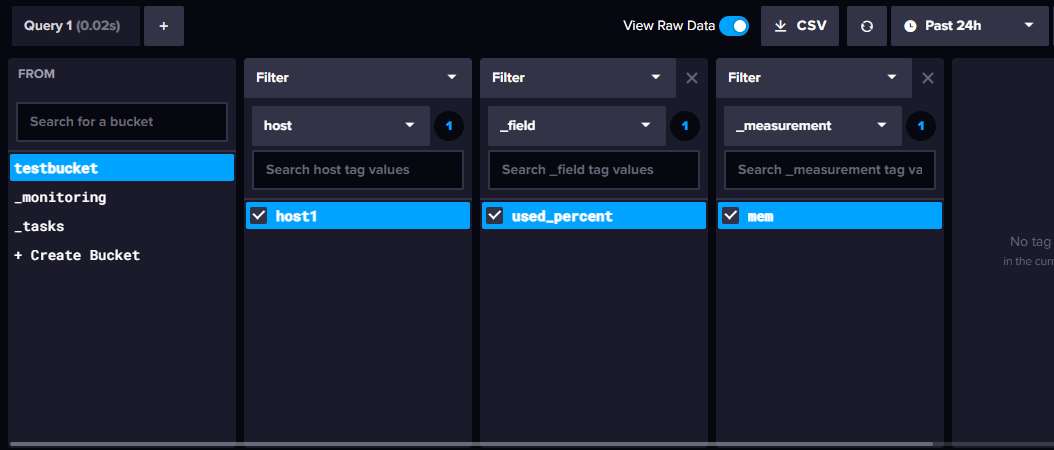
|> filter(fn: (r) => r["_measurement"] == "mem" and r["host"] == "host1")Building Queries in the UI
The InfluxDB web interface provides a visual Query Builder where you can construct queries by clicking:
- Navigate to Data Explorer in the left sidebar
- Select a bucket from the list
- Add filters for tags, fields, and measurements
- The UI builds the query for you
To see or edit the generated Flux code:
- Click the Script Editor button (next to the Submit button)
- The Flux query appears as editable code
- You can modify it manually and run it
TIP
When switching from the visual builder to the Script Editor, time range selections from the UI dropdown are not included in the code. You will need to add the range() function manually.
Grouping
Use group() to re-group your data by specific columns.
flux
from(bucket: "my-bucket")
  |> range(start: -1d)
  |> filter(fn: (r) => r["_measurement"] == "mem")
|> group(columns: ["_field"])This groups all records by the _field column, combining data from different hosts or tags into the same group.
Aggregation
Aggregation functions summarize data. They can be applied over time windows or over the entire result set.
Windowed Aggregation
aggregateWindow() groups data into fixed time intervals and applies an aggregation function to each window.
flux
from(bucket: "my-bucket")
  |> range(start: -2d)
  |> filter(fn: (r) => r["_measurement"] == "temperature")
  |> aggregateWindow(every: 1h, fn: mean)
|> yield(name: "hourly_mean")Another example
from(bucket: "lesson")
  |> range(start: -2d)
  |> filter(fn: (r) => r["_measurement"] == "measurement1")
  |> filter(fn: (r) => r["_field"] == "field1")
  |> aggregateWindow(every: 15m, fn: mean, createEmpty: false)
|> yield(name: "hourly_mean")This calculates the hourly mean temperature over the last 2 days.
Common aggregation functions:
| Function | Description |
|---|---|
mean | Average of values in the window |
sum | Total of values in the window |
max | Highest value in the window |
min | Lowest value in the window |
count | Number of values in the window |
The every parameter controls the window size:
flux
|> aggregateWindow(every: 5m, fn: mean)    // 5-minute averages
|> aggregateWindow(every: 1h, fn: max)     // hourly maximum
|> aggregateWindow(every: 1d, fn: sum) // daily totalsYield
yield() names the output table from a query. This is useful when a single query produces multiple result sets.
flux
|> yield(name: "mean")Full-Range Aggregation
To aggregate over the entire time range (not windowed), use the aggregation function directly:
flux
from(bucket: "my-bucket")
  |> range(start: -7d)
  |> filter(fn: (r) => r["_measurement"] == "temperature")
|> mean()This returns a single value -- the mean temperature over the last 7 days. The result has no timestamp since it covers the entire range.
Example Queries
Memory usage from a specific host (last 24 hours)
flux
from(bucket: "testbucket")
  |> range(start: -1d)
  |> filter(fn: (r) => r["host"] == "host1")
  |> filter(fn: (r) => r["_field"] == "used_percent")
|> filter(fn: (r) => r["_measurement"] == "mem")Daily average temperature (last 7 days)
flux
from(bucket: "sensors")
  |> range(start: -7d)
  |> filter(fn: (r) => r["_measurement"] == "temperature")
  |> filter(fn: (r) => r["location"] == "office")
  |> aggregateWindow(every: 1d, fn: mean)
|> yield(name: "daily_avg")Peak CPU usage per hour
flux
from(bucket: "monitoring")
  |> range(start: -24h)
  |> filter(fn: (r) => r["_measurement"] == "cpu")
  |> filter(fn: (r) => r["_field"] == "usage_percent")
  |> aggregateWindow(every: 1h, fn: max)
  |> yield(name: "hourly_peak")